You may be interested to know more about vector and raster data. In this article, I will provide details about the two different types of data, give reviews about the data’s types, explain what makes them different, and more. I will also offer links to various YouTube videos in case you need to visually see the difference of vector data vs raster data.
What are the different types of GIS data?
There are three different types of GIS data, which include spatial, attribute, and metadata. Vector data, raster data, images, Triangular Irregular Networks (TINs), and terrain datasets are all apart of Spatial data. Attribute data is made up of details such as the information that explains “where”, “what”, and “why”. It provides characteristics about the spatial data. Metadata consists of information involving scale, accuracy, projection, data source, manipulations, and how the data is obtained.

For the purpose of this article, I will be focusing solely on spatial data since it involves vector and raster data. Spatial data is important, as it is data that contains information about locations on the surface of the Earth. This data is continuously being assessed and evaluated in a variety of different fields, but GIS experts are more prominent users of the term.
What exactly is the vector type of data?

Definition: Vector data is the process of representing real world objects and features within the GIS field. This means that anything that you can visually see in a landscape, such as trees, houses, and rivers, can be represented in a GIS application.
Main Purpose/ Specification: The main purpose is to be able to add everything that the human eye can see in a visual location to a GIS application. This can help individuals answer the following questions: where is the best place to put a business in the area, how many houses are at risk of a flood, how many people live in this specific area, and more.
Formats: Vector data usually is represented by using geometry. The geometry typically consists of vertices, which are X, Y, and Z coordinates and form into specific landscape features. The different types of vector data are point, line, or polygon.
Advantages: An advantage of vector data is that it can be used to map out an entire landscape as well as its features. It also can be used to answer difficult questions without going to the landscape site.
Disadvantages: A common disadvantage of vector data is that it can be collected at different scales which may interfere with the process and its accuracy. It also needs to be constantly updated to remain up to date, reliable, and accurate. This type of data is tedious and does require careful, detail oriented data collection.
If you are interested in learning more about GIS vector data, Civil Gem offers an excellent video on their YouTube Channel. You can check out this video. By watching this video, you will learn how vector data is structured, how vector features are created, the object model of vector data, and the precision of vector calculations.
Vector data’s types

Point: Using point for your vector data is your decision to make. Point works best depending on how far you are from the specific feature, how much time you have, and the type of feature that you are wanting to put on your GIS application. Point features consist of X, Y, and, sometimes, Z coordinates. If you do not have a lot of time, point is the data type that takes the least amount of time, but it is not recommended for large scale maps.
Line: The line data type usually contains two or more vertices (the letters or edges). When you make two vertices connect, a line will be formed. A line makes sense when you would like to show features such as roads, walking paths, and rivers. When more than two vertices are joined, you will then have what is called a “line of lines,” or a polyline.
Polygon: Polygon features are used to show objects like islands, dams, land boundaries, and more. If you decide to use polygon data, you will use a layer of lines to form a connection and create an enclosed area. An important part to remember about the polygon feature is that the first and last vertices must always reach the same place.
Volume: Volume is when your goal is to represent a three-dimensional shape. A polyface tends to be the most common three-dimensional shape, which is made up of three-dimensional polygons and creates a surface.
What exactly is the raster type of data?

Definition: Raster data is made up of pixels which are also called cells. Every pixel involves a value that represents the conditions of the area. This type of data is better to use when you want to show something that is continuous. For example, raster data works better when showing grasslands because you can show continuous features and their attribute values. Grasslands are a continuous feature that varies by density and color. You can show this by using raster data.
Main Purpose/ Specification: The main purpose of raster data is to show objects that are continuous as well as their attribute values.
Formats: Raster data is a form of grid data that is typically represented by numbers and describes the detailed characteristics of the areas, such as the elevation level, the population, herbicide use, the risk of fire, the amount of rainfall, and more.
Advantages: An advantage of raster data is that you are able to look at your GIS application and see the various characteristics that were collected. These characteristics can be used to make important decisions without going to the area location.
Disadvantages: A disadvantage of raster data is that it can be difficult to capture. It is usually collected by aerial photography or satellite imagery. It also requires a large amount of computer storage to be able to see the high resolution data, which is common among raster data.
If you are interested in learning more about GIS raster data, you can watch Civil Gem’s YouTube video here. The video will briefly go over the raster data model, the important building blocks of raster data, the process of transformations and overlays, and imagery and surfaces.
Raster data’s types

Discrete (Thematic/ Categorical): Discrete data is most often used to represent soils, vegetation, and land-use. Majority of individuals have best results if they use integer values to represent discrete data.
Continuous: Continuous data is used to represent the elevation, temperature, precipitation, and light in the area. Floating point values are recommended to represent continuous data in areas.
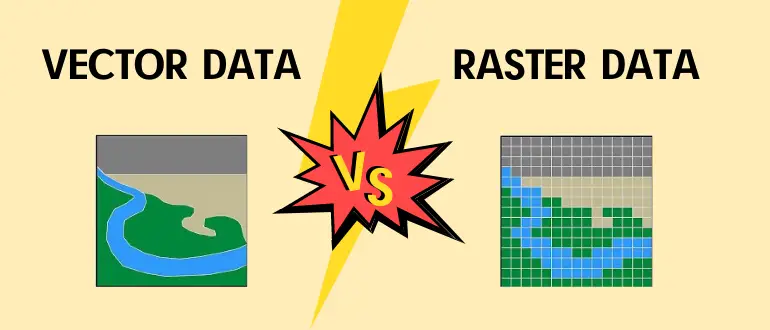
What are the differences between vector and raster data?
As you can see, vector and raster data are very different. Most of the time Vector data uses X and Y coordinates to mark the location of the points, lines, and polygons. These points, lines, and polygons declare the location of objects such as fire hydrants, roads, walkways, and more. Raster data uses squares, which are known as pixels or cells, to mark where certain features are located. These pixels look like grids, and they are usually the same size. The size controls how much detail is shown and can be updated and altered in the dataset. In simple terms, vector data focuses on declaring boundaries and locations, whereas raster data focuses on describing what is within the area.
To learn more in-depth about the differences between raster and vector data with visuals, you can watch the video on Rhumb Line Maps’ YouTube channel here. He gives a great description explaining the two types of data that are commonly used in GIS and their distinct differences.
Conclusion
After reading this article, you should be able to come to a decision about which type of data will work best for your GIS project. Both, vector and raster data, have very different uses and will benefit your project in different ways. Some projects may even require the usage of both. The objective is to make sure that you are using each type of data and representing the areas the correct way. In the meantime, you can check out our list of the best laptops for GIS or the best GIS certificate programs to further your education.